You have probably heard a lot about different exercise intensities or heart rate zones. CrossFit is defined as constantly varied functional movements executed at high intensity, but high intensity doesn't mean 110% effort all the time. We need to dial back intensity for longer workouts and hit the gas pedal for shorter workouts. It can be helpful to define different exercise intensities to allow us to hit the intended workout stimulus. In this article, we will discuss how exercise intensities are measured and quantified and how that applies to your CrossFit workouts.
We will focus on defining training intensity and several methods that can be used to quantify or measure your training intensity in real time. In order to do so, we will talk about a few “thresholds” that have been studied and measured via blood samples and how that relates to the energy systems we discussed in the article: The Engine Inside: How Cells Power Your Workouts.
Your muscles have multiple ways to produce energy. At lower intensities, they rely mostly on aerobic metabolism — using oxygen to burn fuel. But as intensity ramps up and oxygen becomes a limiting factor, your body shifts more toward glycolysis, an anaerobic pathway that breaks down glucose/glycogen without oxygen. One byproduct of glycolysis is lactate. As glycolysis kicks into overdrive with higher intensity exercise, lactate will start to accumulate in the blood. Lactate present in the blood can be used to define exercise intensities via several lactate thresholds measured via blood samples.
Lactate threshold 1 is the point at which lactate starts to accumulate in our blood above normal baseline levels, which will occur as our exercise intensity increases. This typically occurs at a blood sample of 2mmol of lactate/L. It is a sign that our body is increasing its use of anaerobic energy pathways (glycolysis). [1,2,3] The next threshold crossed as training intensity increases, is lactate threshold 2, which is the point where the accumulation of lactate in the blood dramatically increases, typically at 4mmol/L. This is a sign that the body is producing lactate faster than it can clear it and the body is definitely relying more on breaking down glucose/glycogen via glycolysis. [4]
Exercise intensities can be described and quantified in many different ways. Using “Zones” is a common method of doing this. However, some studies use a 3 zone method and some use a 5 zone method. Both the 3 and 5 zone methods can utilize the lactate thresholds to delineate the different zones.
See the image below for the 3 Zone model:
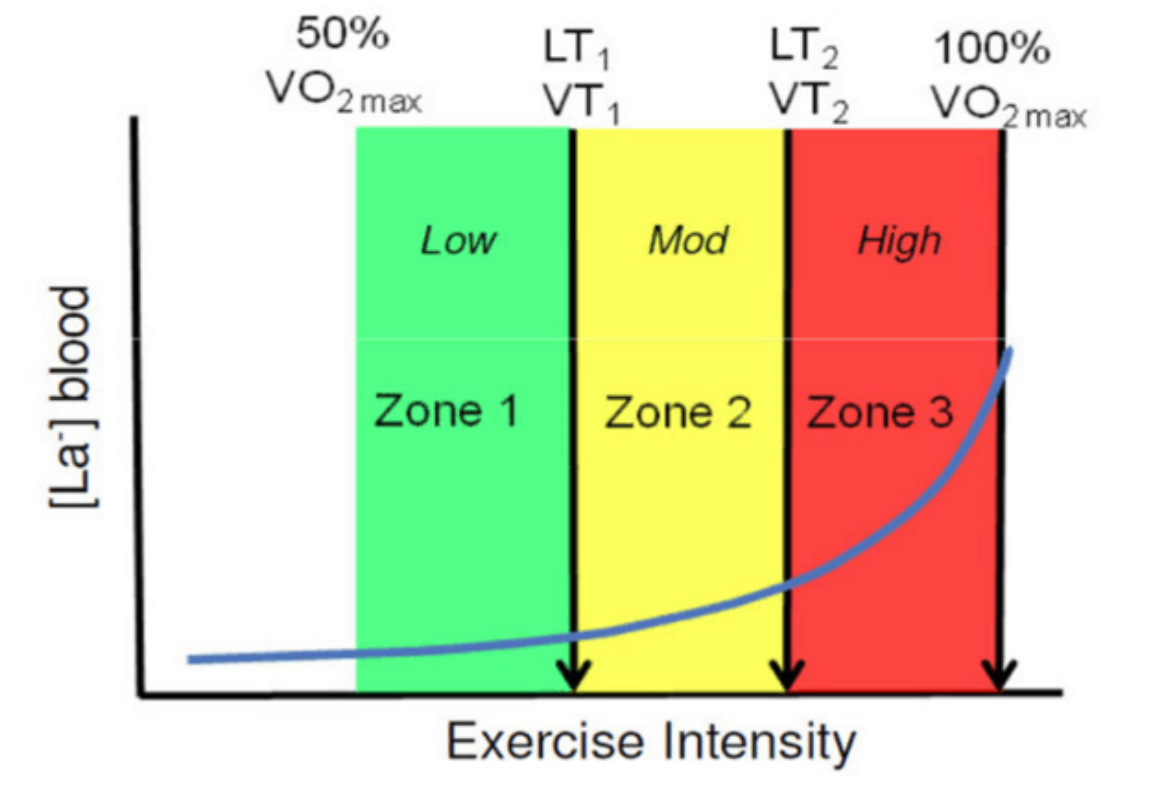
In the 3 Zone model, [5]
See the image below for the 5 zone model,
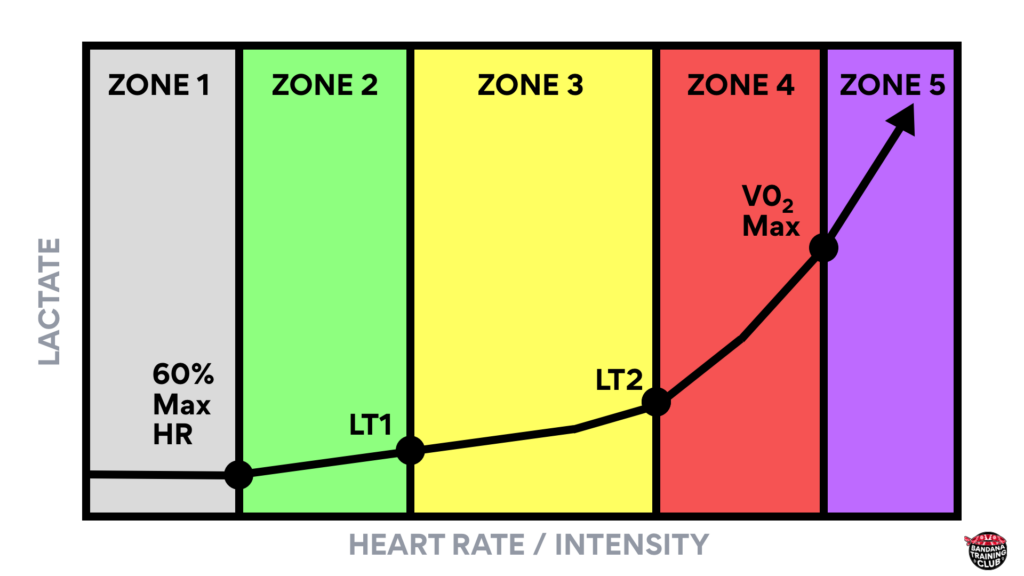
In the 5 zone model,
We can further define the zones as relative intensities: [7]
Now, if we all wanted to be super accurate at defining our training zones based on the lactate thresholds, we could purchase a lactate meter for about $200; the Edge has been a well validated meter. [8] However, it is unrealistic and likely not needed for most of us to directly measure our blood lactate thresholds during workouts, so several systems have been devised to help estimate the relationship of how hard you are working with lactate blood levels and include using a percentage of our heart rate, a subjective rating of effort, and the talk test.
Two methods of using our heart rate to define exercise intensity or training zones are
For the first, we can calculate our theoretical max heart rate by subtracting our age from 220. For example, a 40 year old would have a theoretical max heart rate of 220-40 = 180. It is a decent estimation but not perfect by any means. The Karvonen formula is slightly better at estimating heart rate zones because it includes an individuals resting heart rate which starts to account for an individual's current fitness level. You can measure your resting heart rate by sitting for more than 4 minutes and measuring how many times your heart beats in 1 minute. You can then calculate your theoretical Heart Rate Max using the same method described above. Regardless of which method you use, the 5 Zone model of intensity is generally calculated as a range of heart rates.
So for a 40 year old male, if we used the theoretical heart rate max of 180, we would find their training zones by multiplying 180 by the percentages for each zone and come up with:
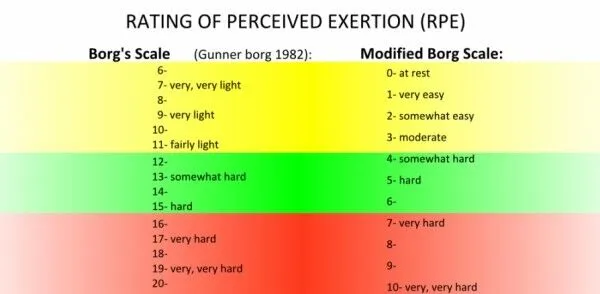
The BORG rating of perceived exertion is a subjective method for grading exercise intensities. The original scale is from 6-20 and can correlate someones perceived level of exertion well with their heart rate, ie a rating of 13 often corresponds with a heart rate of 130. Sometimes the 6-20 scale can be less intuitive to rate how hard you are working so a modified scale 0-10 was created with 0 being at rest and 10 being maximal effort. Both Borg scales have been shown to have decent relationship to blood lactate thresholds. For the Borg Scale 6-20, a value of approximately 10 corresponded with blood lactate level 1 and a value of 14 corresponded with a lactate threshold 2. [9,10,11] The ACSM defines moderate intensity as RPE of 3-4 out of 10 and vigorous as 5-7 out of 10. [12]
Another method of prescribing exercise intensity is using the “talk test”. The talk test utilizes the fact that as exercise intensity increases, respiratory rate increases, and the effort required to speak increases. Because respiratory rate, intensity, and lactate thresholds are interrelated, using the effort required to talk is a decent estimation of exercise intensity. Rating the difficulty of speaking can be described many ways but studies often delineate it as: comfortable, less comfortable/hard, and unable to speak comfortably. Some studies have shown that the transition from comfortable to less comfortable/hard corresponds to lactate threshold 1 and the transition from less comfortable/hard to unable to speak sentences corresponds to lactate threshold 2. CDC uses the talk test to define moderate intensity exercise as levels where someone can talk but not sing and vigorous intensity as levels where it would be uncomfortable for someone to talk. [13,14]
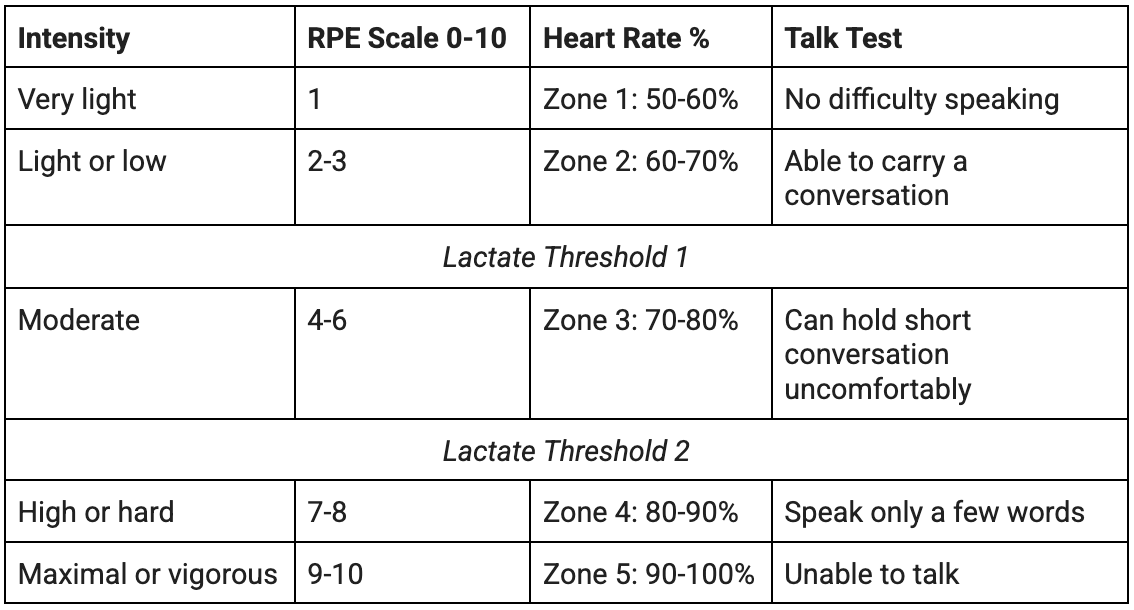
None of these methods of quantifying exercise intensity are perfect but they gives us tools to estimate to the best of our ability. Ultimately, using a cluster of these tools likely will give us the best estimation of our relative exercise intensity. The chart below does a decent job of combining intensity, exercise RPE scale, heart rate %, lactate thresholds, and the talk test.
Phew, once again that was a lot of information. Let’s summarize a little…we can delineate relative exercise intensity by blood lactate levels with lactate threshold 1 and lactate threshold 2, which tells us more about how our cells are creating energy for exercise. These thresholds help to define either a 3 zone or 5 zone exercise intensity model. We can use heart rate, perceived exertion, or the effort to speak as ways to estimate the zone or intensity of any given activity or bout of exercise. These methods have limitations but perhaps using a combination of heart rate, perceived exertion, and the talk test can help us get pretty darn close to desired exercise intensities. We will leave the nitty gritty discussion of how exercise intensity affects what energy systems our cells use for a future article.
Understanding exercise intensity isn’t just about numbers on a heart-rate monitor—it’s about learning how your body responds to different types of effort so you can train smarter, recover better, and get more out of every workout. When you start recognizing the differences between light, moderate, and vigorous intensity—and how factors like breathing, talking ability, and perceived effort line up—you gain a powerful tool for improving your fitness over time.
At Fortitude Fitness, we apply these principles every day. Not all intensity is created equal, and it shifts depending on the type of workout. For shorter interval pieces—think sprints, EMOM bursts, or fast repeats—we expect athletes to work at higher relative intensities, often in Zones 4–5 or hitting 8–10 on the exertion scale. These efforts are meant to be uncomfortable, explosive, and unsustainable for long periods. In contrast, longer Metcons require you to dial in a manageable, moderate–high intensity that you can stay consistent with—typically Zones 2–3 early on, pushing toward Zone 4 as fatigue builds. Instead of sprinting, the focus becomes pacing, breathing, and strategic movement choices.
By understanding and applying these intensity concepts—whether through heart-rate zones, the talk test, or perceived exertion—you’ll be able to approach each class with confidence. You’ll know when to push, when to pace, and how to build capacity week after week. The goal isn’t to go “all out” every day; it’s to train with intention so your strength, endurance, and overall fitness continue to rise.
At Fortitude Fitness, intensity is always relative—scaled to your current ability, goals, and experience. By learning what different intensities feel like in your body, you’ll get more from each workout and become a smarter, more resilient athlete. That’s how we build fortitude—one well-paced, well-executed training session at a time.
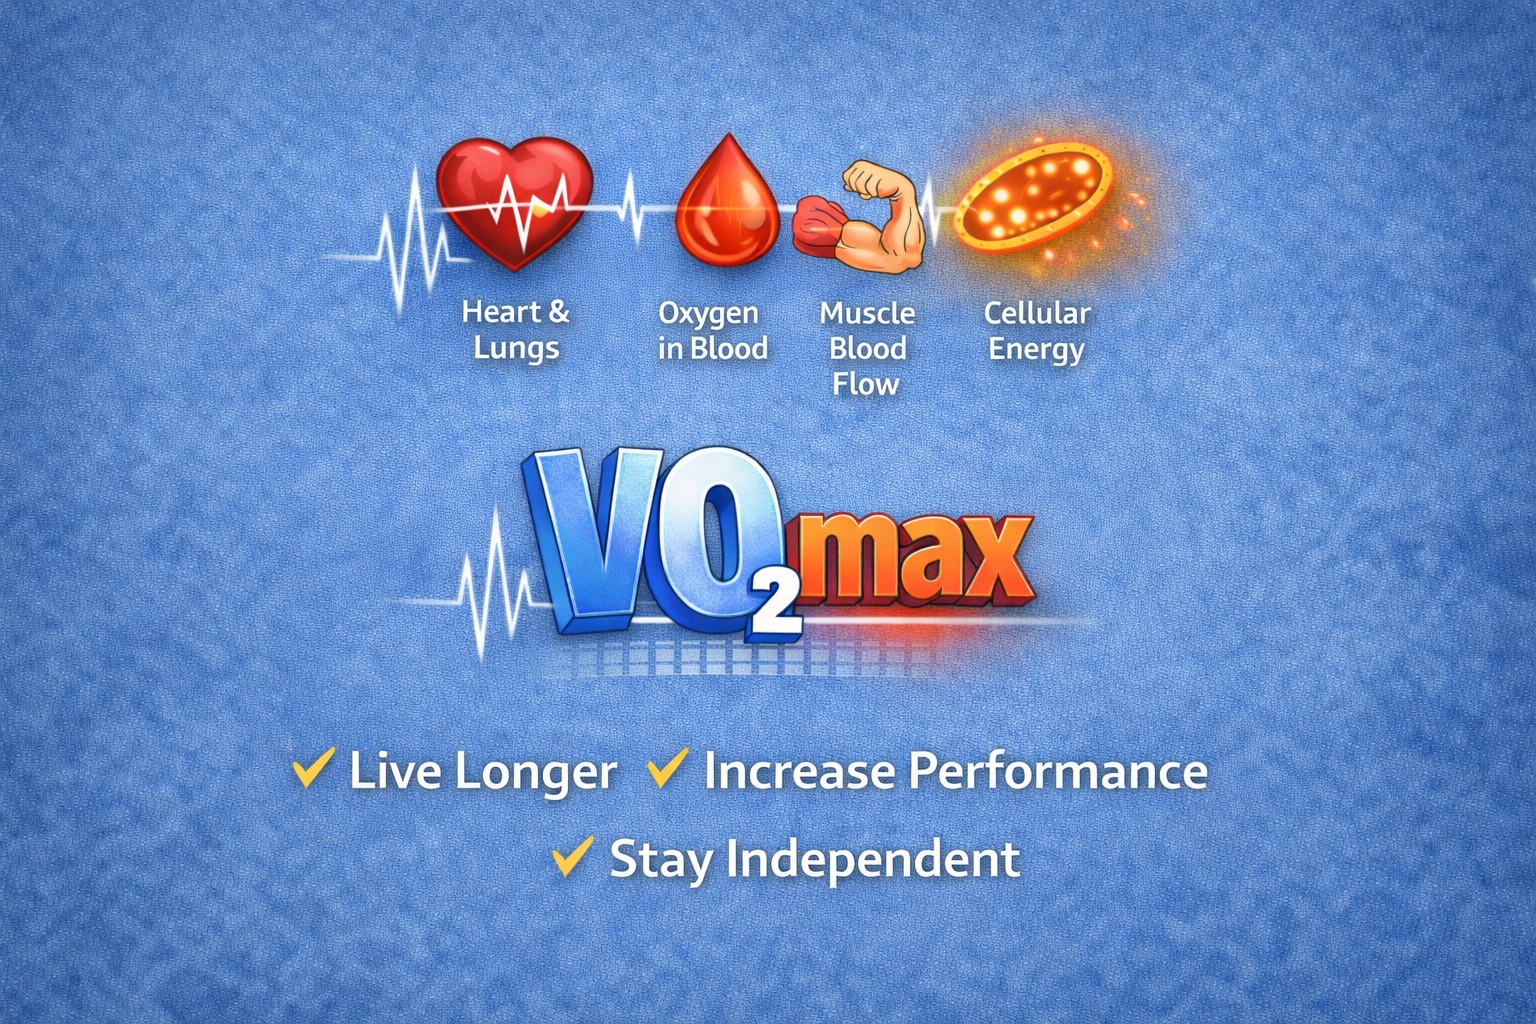
In the next blog article, we will define what VO2Max is and how exercise can help improve our VO2Max, which is an important biomarker for overall health and fitness.
[1] Haff, G. G., & Triplett, N. T. (Eds.). (2016). Essentials of strength training and conditioning (4th ed.). Human Kinetics.
[2] Stöggl, T. L., & Sperlich, B. (2015). The training intensity distribution among well-trained and elite endurance athletes. Frontiers in Physiology, 6, 295. https://doi.org/10.3389/fphys.2015.00295
[3] Physio-pedia. (n.d.). Lactate threshold. In Physio-pedia. Retrieved November 25, 2025, from https://www.physio-pedia.com/Lactate_Threshold
[4] Ghosh, A. K. (2004). Anaerobic threshold: Its concept and role in endurance sport. Malaysian Journal of Medical Sciences, 11(1), 24–36.
[5] Bishop, D. J., Lee, M. J.-C., & Picard, M. (2025). Exercise as mitochondrial medicine: How does the exercise prescription affect mitochondrial adaptations to training? Annual Review of Physiology, 87, 107–129. https://doi.org/10.1146/annurev-physiol-022724-104836
[6] Bandana Training. (2023, May ? – page last updated). Understanding heart‑rate training zones, VO₂ max, & lactate threshold. Retrieved November 27, 2025, from https://bandanatraining.com/heart-rate-training-zones/
[7] Polar Electro. (n.d.). Heart rate zones | Polar guide. Retrieved November 25, 2025, from https://www.polar.com/en/guide/heart-rate-zonesCleveland Clinic. (2025, October 6). What to know about exercise and heart rate zones. Cleveland Clinic. https://health.clevelandclinic.org/exercise-heart-rate-zones-explained/
[8] Bonaventura, J. M., McManus, C. J., Trappe, S. W., & Crawford, T. O. (2015). Reliability and accuracy of six hand‑held blood lactate analyzers. Journal of Sports Science & Medicine, 14(2), 203–214. https://doi.org/10.1016/j.jsams.2015.03.001
[9] Scherr, J., Wolfarth, B., Christle, J. W., Pressler, A., Wagenpfeil, S., & Halle, M. (2013). Associations between Borg’s rating of perceived exertion and physiological measures of exercise intensity. European Journal of Applied Physiology, 113(1), 147–155. https://doi.org/10.1007/s00421-012-2421-x
[10] Ramos‑Jiménez, A., Wall Medrano, A., Hernández Lepe, M. A., Chávez Treviño, G., Guereca Arvizuó, J., & Hernández Torres, R. P. (2018). Borg’s category ratio‑scale (CR‑10) is useful to predict the onset of blood lactate accumulation (OBLA) in young Mexicans adults, regardless their body mass. CIENCIA ergo sum, 26(1), 1–14. https://doi.org/10.30878/ces.v26n1a7 researchgate.net+1
[11] Abe, D., Yoshida, T., Ueoka, H., Sugiyama, K., & Fukuoka, Y. (2015). Relationship between perceived exertion and blood lactate concentrations during incremental running test in young females. BMC Sports Science, Medicine and Rehabilitation, 7, 5. https://doi.org/10.1186/2052-1847-7-5
[12] American College of Sports Medicine. (2025, February). Aerobic exercise intensity infographic. https://acsm.org/wp-content/uploads/2025/02/Exercise-intensity-infographic-PDF.pdf
[13] Quinn, T. J., & Coons, B. A. (2011). The Talk Test and its relationship with the ventilatory and lactate thresholds. Journal of Sports Sciences, 29(11), 1175–1182
[14] De Lucca, L., De Oliveira, F. R., Foster, C., Carminatti, L. J., & others. (2021). Talk Test: A simple alternative to identify lactate thresholds during progressive cycling exercise. Kinesiology, 53(1), 20–27. https://doi.org/10.26582/k.53.1.3